Calculating SFH with Diffstar and DiffstarPop
This notebook gives two basic illustrations of how to use diffstar to model the SFHs of individual and populations of galaxies.
SFH of an individual diffstar galaxy
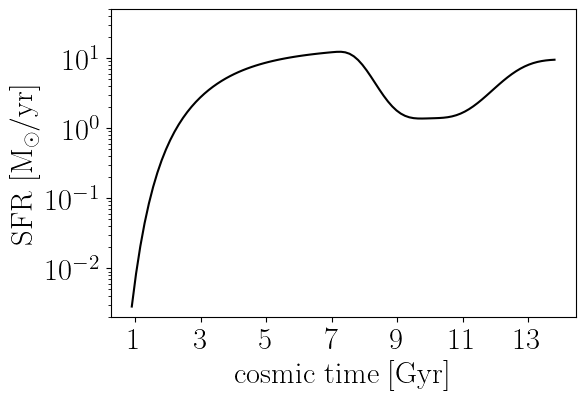
In the cell below, we’ll use the default diffmah and diffstar parameters, and then use the sfh_singlegal function to calculate the SFH.
[1]:
import subprocess
from matplotlib import pyplot as plt


def try_enable_latex():
    """Try enabling LaTeX text rendering in matplotlib,
    fallback if not available."""
    try:
        # Quick check: can we run latex?
        subprocess.check_call(
            ["latex", "--version"],
            stdout=subprocess.DEVNULL,
            stderr=subprocess.DEVNULL,
        )
        plt.rc("text", usetex=True)
        plt.rc("font", family="serif", size=22)
        plt.rc('figure', figsize=(6,4))
        print("LaTeX rendering enabled.")
    except (subprocess.CalledProcessError, FileNotFoundError):
        # LaTeX not installed or failed
        plt.rc("text", usetex=False)
        plt.rc("font", family="serif", size=22)
        plt.rc('figure', figsize=(6,4))
        print("LaTeX not available, falling back to default mathtext.")

try_enable_latex()
LaTeX rendering enabled.
[2]:
import numpy as np
from diffmah.defaults import DEFAULT_MAH_PARAMS
from diffstar.defaults import DEFAULT_DIFFSTAR_PARAMS

today_gyr = 13.8
LGT0 = np.log10(today_gyr)
DEFAULT_FB = 0.156
tarr = np.linspace(0.9, today_gyr, 100)
[3]:
from diffstar import calc_sfh_singlegal

sfh_gal = calc_sfh_singlegal(
    DEFAULT_DIFFSTAR_PARAMS, DEFAULT_MAH_PARAMS, tarr,
    lgt0=LGT0, fb=DEFAULT_FB)
[4]:
fig, ax = plt.subplots(1, 1)
ylim = ax.set_ylim(2e-3, 50)
yscale = ax.set_yscale('log')

__=ax.plot(tarr, sfh_gal, color='k')

xlabel = ax.set_xlabel(r'${\rm cosmic\ time\ [Gyr]}$')
ylabel = ax.set_ylabel(r'${\rm SFR\ [M_{\odot}/yr]}$')
ax.set_xticks(np.arange(1.0, 14.0, 2.0))
[4]:
[<matplotlib.axis.XTick at 0x73c547f79bd0>,
 <matplotlib.axis.XTick at 0x73c55cd21f90>,
 <matplotlib.axis.XTick at 0x73c547fdca50>,
 <matplotlib.axis.XTick at 0x73c547fdea10>,
 <matplotlib.axis.XTick at 0x73c547fe00d0>,
 <matplotlib.axis.XTick at 0x73c547fe2150>,
 <matplotlib.axis.XTick at 0x73c547fe41d0>]
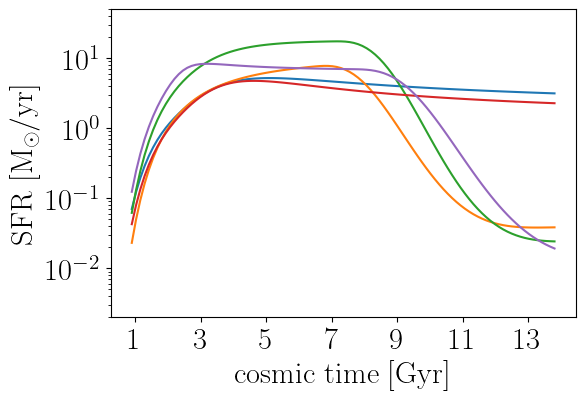
Generating populations of galaxy SFHs with DiffstarPop
DiffstarPop is a population-level model of Diffstar SFHs. DiffstarPop is formulated to capture \(P(\theta_{\rm SFH}\vert\theta_{\rm MAH}),\) the PDF of diffstar properties, \(\theta_{\rm SFH},\) conditioned on the diffmah parameters of halo mass assembly, \(\theta_{\rm MAH}.\)
In the cells below, we will first create a population of halos all with the same diffmah parameters, DEFAULT_MAH_PARAMS. And then we will use DiffstarPop to create a Monte Carlo realization of the galaxy SFHs that live in the halos. As an alternative, you could use the DiffmahPop model to create a Monte Carlo realization of halo MAHs, or you could use the best-fitting diffmah parameters taken from an N-body simulation.
The DiffstarPop model produces different SFH distributions for central vs satellite halos. For purposes of this demonstration, we will create a population of central halos. And so when creating our population of halos with the same MAHs, we will use fill values appropriate for centrals for all additional satellite-specific arguments.
[5]:
from jax import random as jran
ran_key = jran.key(0)
[6]:
from diffstar.diffstarpop import mc_diffstar_sfh_galpop, DEFAULT_DIFFSTARPOP_PARAMS
from diffmah import logmh_at_t_obs

n_halos = 5_000
ZZ = np.zeros(n_halos)

ran_key, sfh_key = jran.split(ran_key, 2)

mah_params = DEFAULT_MAH_PARAMS._make([x+ZZ for x in DEFAULT_MAH_PARAMS])
logmp0 = logmh_at_t_obs(mah_params, today_gyr, np.log10(today_gyr))
[7]:
lgmu_infall = -1.0 + ZZ
logmhost_infall = logmp0
gyr_since_infall = ZZ
upids = np.zeros(n_halos).astype(int)-1

mc_diffstar_result = mc_diffstar_sfh_galpop(
    DEFAULT_DIFFSTARPOP_PARAMS,
    mah_params,
    logmp0,
    upids,
    lgmu_infall,
    logmhost_infall,
    gyr_since_infall,
    sfh_key,
    tarr,
    lgt0=LGT0, fb=DEFAULT_FB
)

print(mc_diffstar_result._fields)
('diffstar_params_ms', 'diffstar_params_q', 'sfh_ms', 'sfh_q', 'frac_q', 'mc_is_q')
The mc_diffstar_sfh_galpop function returns a namedtuple storing Diffstar parameters and SFHs for two different possible outcomes, depending on whether the galaxy does or does not experience a quenching event. In order to select a Monte Carlo realization of the outcome, we use the mc_is_q value as follows:
[8]:
sfh = np.where(
    mc_diffstar_result.mc_is_q.reshape((n_halos, 1)),
    mc_diffstar_result.sfh_q, mc_diffstar_result.sfh_ms
)
[9]:
fig, ax = plt.subplots(1, 1)
ylim = ax.set_ylim(2e-3, 50)
yscale = ax.set_yscale('log')

for igal in range(5):
    __=ax.plot(tarr, sfh[igal, :])


xlabel = ax.set_xlabel(r'${\rm cosmic\ time\ [Gyr]}$')
ylabel = ax.set_ylabel(r'${\rm SFR\ [M_{\odot}/yr]}$')
ax.set_xticks(np.arange(1.0, 14.0, 2.0))
[9]:
[<matplotlib.axis.XTick at 0x73c53d763090>,
 <matplotlib.axis.XTick at 0x73c53d48f050>,
 <matplotlib.axis.XTick at 0x73c53d4804d0>,
 <matplotlib.axis.XTick at 0x73c53d4b2750>,
 <matplotlib.axis.XTick at 0x73c53d4a5350>,
 <matplotlib.axis.XTick at 0x73c53d4c4890>,
 <matplotlib.axis.XTick at 0x73c53d504e10>]
[ ]: